To complete each control step for a possible failure mode, as described in the previous article,
gear-specific material data is required. This data is obtained by dedicated gear testing
methods. Currently there are no standardized test procedures available, which could be
employed to generate this data. However the VDI 2736:Part 4 [1] which provides comprehensive
recommendations for the testing methodology.
S-N curve testing
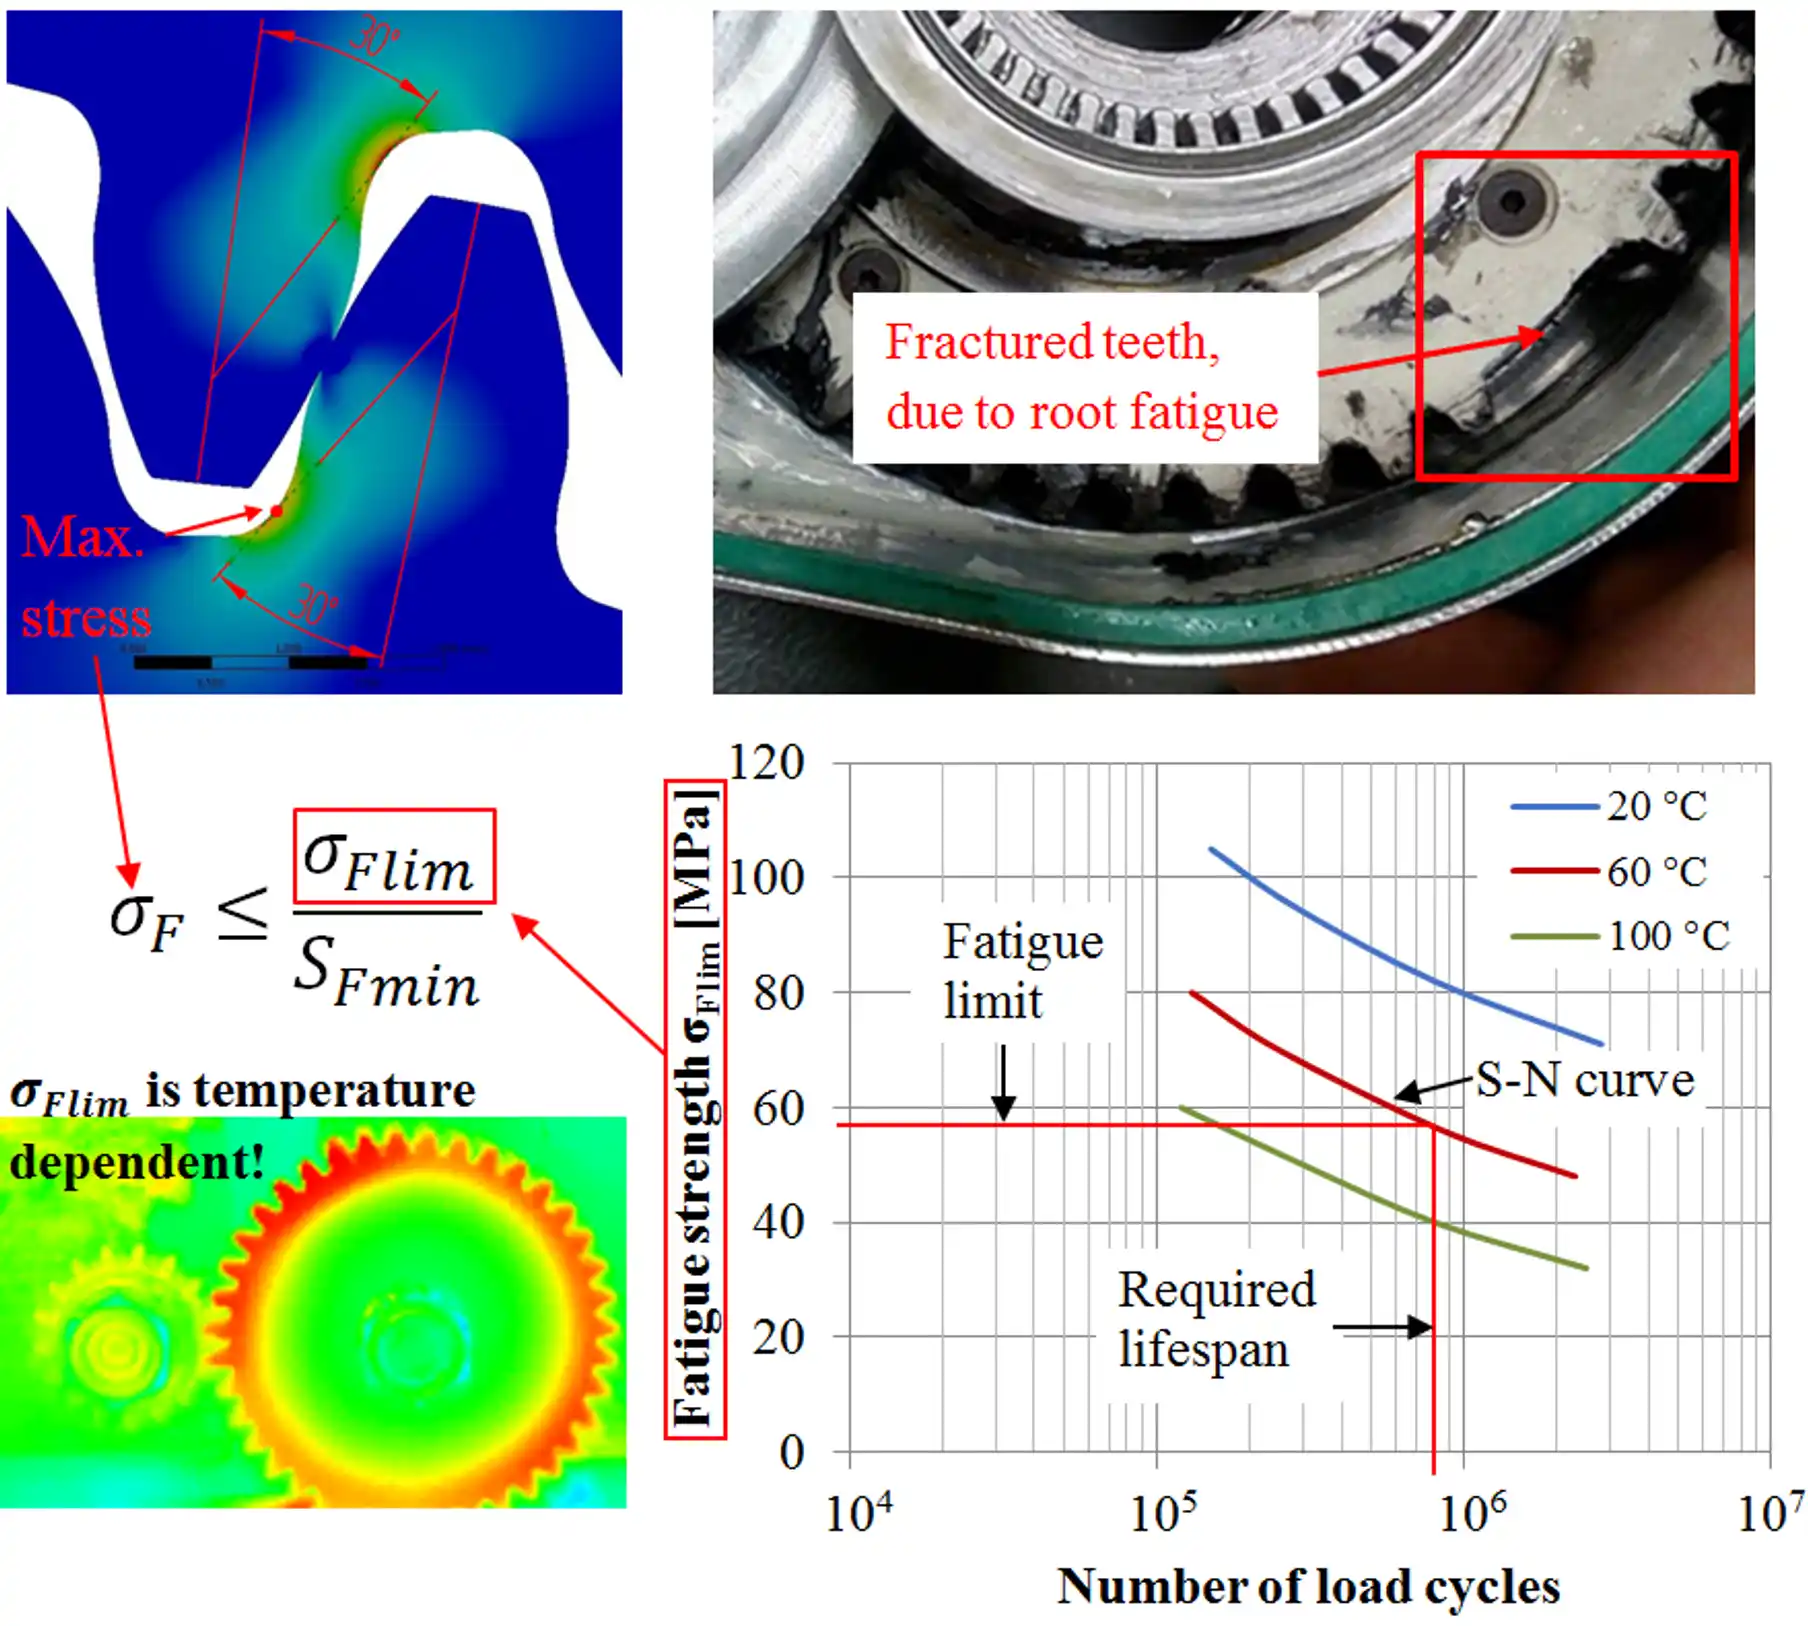
To avoid root fatigue failure, the root stress in a gear needs to be lower than the
material's fatigue strength limit for the required operating lifespan. To account for
unexpected effects some additional safety is usually also included. The
information on the material's fatigue strength can be summarized in an S-N
curve. To generate an S-N curve, several test repetitions need to be conducted
at various loads, and all the samples need to be tested until a fatigue induced
failure occurs. For gears, the S-N curves can be generated by extensive testing
in a gear-on-gear application or by a single tooth bending test on a pulsator
test stand. Both methods have their pros and cons.
In a gear-on-gear test
methodology usually a combination of a steel pinion and a plastic gear is
employed. The steel/plastic combination is most appropriate for the S-N curve
testing since the curve is a property of a single material. Therefore the
failure should occur on the gear of which the material is being evaluated. In
case of a plastic/plastic combination the failure would be close to impossible
to control, and a situation could occur where it would not be possible to
induce a failure on a gear made of material under evaluation. Another problem
with a plastic/plastic gear combination would be a significantly increased
tooth contact, and the actual stress in the material would further deviate from
the calculated one. The one calculated by the analytical equation (VDI 2736 or
DIN 3990 or ISO 6336), FEA provides an accurate stress calculation if the
numerical model is set up accordingly.
While operating, the gears
heat up. Friction between the meshing teeth and hysteretic effects are the main
reasons for the temperature increase in plastic gears. The rate of the heat
generation and the resulting temperature rise depend on several factors, e.g.
torque, rotational speed, coefficient of friction, lubrication, thermal
conductivity, convection, gear geometry, etc. The mechanical properties
(strength, hardness, elastic modulus) of polymers and polymer composites are
strongly temperature dependent. Therefore, several S-N curves, generated for
different temperatures of the tested sample, are required for the design of
plastic gears. Precise temperature control of tested gear samples is therefore
crucial for characterization of S-N curves for plastic gears.
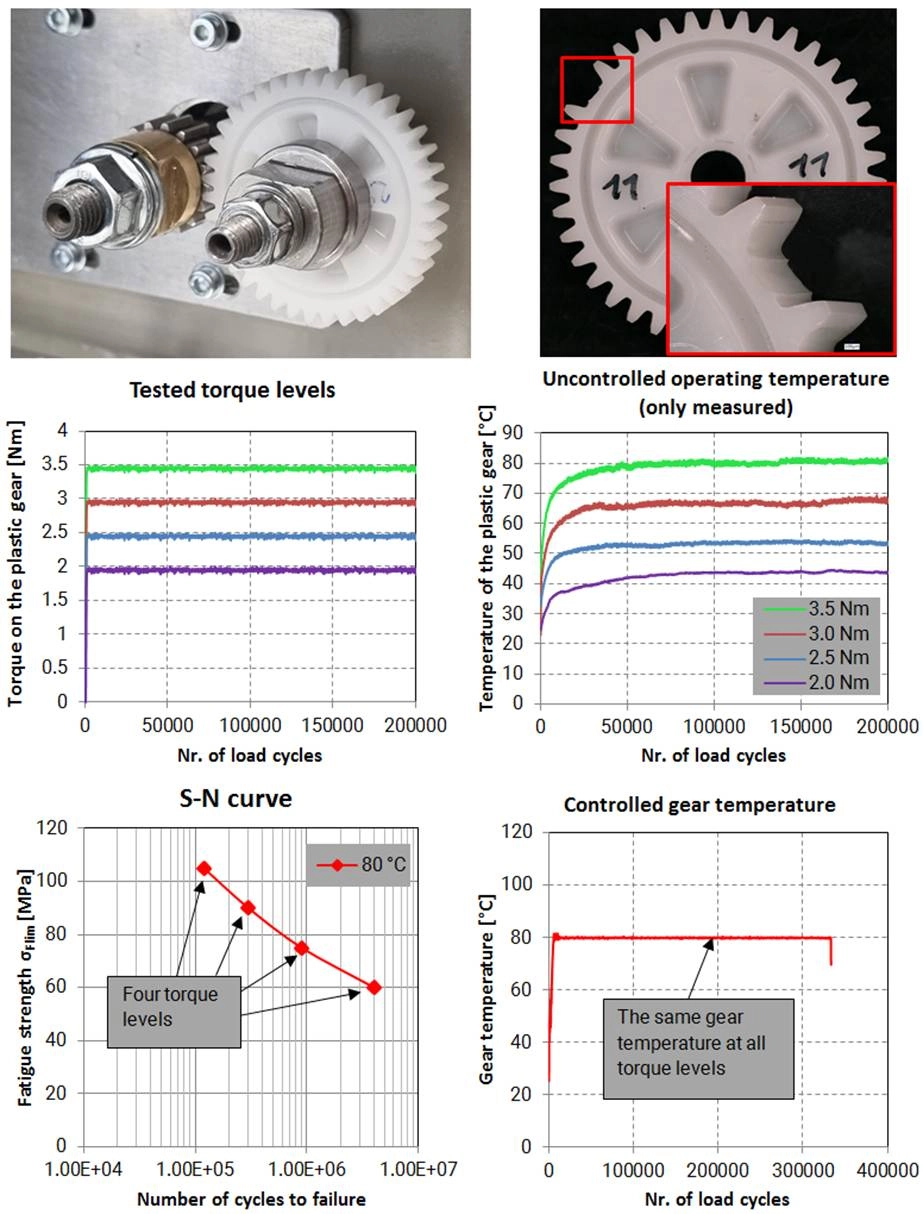
Fig. 1: S-N curve generation; A combination of a steel pinion and a plastic gear is usually
employed for the S-N curve generation. As the purpose of testing is to generate fatigue data on
the selected plastic material, the failure needs to occur on the plastic gear. Test needs to be
stopped when the first tooth is fractured. In a plastic / plastic configuration the failure
would be impossible to control, usually both gears get damaged at the end of test. Furthermore,
the load induced contact ratio increase would be even higher for a plastic/plastic gear
configuration. Tested gears need to be tested at least at four different load levels, where the
torque is accurately controlled during testing. The operating temperature of the plastic gear
needs to be controlled at a selected level at all tested torques. At least three test
repetitions need to be conducted at each tested torque level in order to ensure repeatability.
All tests need to be conducted until a fatigue induced failure.
Wear characterization
Wear behavior of plastic
gears can be best studied by conducting gear tests. Simple tribological tests,
e.g. disk-on-disk can provide basic information about materials behavior in a
rolling-sliding motion under non-conformal contact, but for an in-deep
understanding of the wear behavior in the gear contact, gear testing needs to
be conducted.
When gears are meshing there
is a combination of rolling and sliding motion present between the surfaces in
contact. The direction of sliding and the frictional force are reversed when
passing through the pitch point C. On the driven gear, the direction of sliding
points always towards the pitch point C, so the kinematic line is usually
clearly visible on the worn gear surface. The main difference, when compared to
the disk-on-disk test, is that with the disk-on-disk test, the sliding rate is
constant all the time and also the direction of the frictional force remains
the same. The pin on disk test is even less suitable, since there is only
sliding motion present in contact without any rolling.
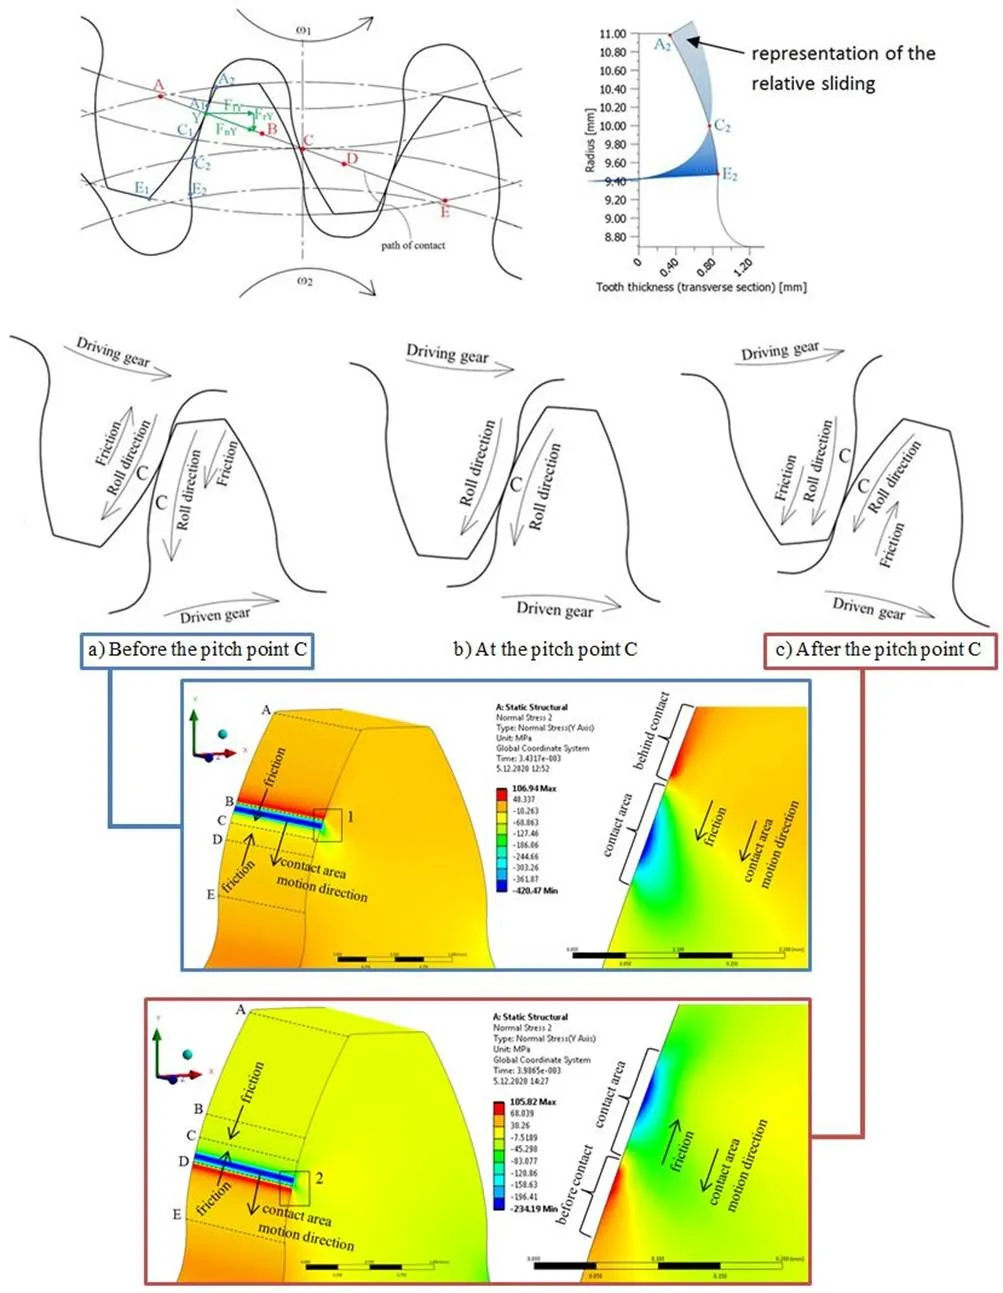
Fig. 2: Contact conditions
during gear meshing. The direction of friction changes once the contact passes
the pitch point. The frictional force is on the driven gear always oriented
towards the pitch point and vice-versa on the drive gear.
The theoretical path of
contact of the involute gears pair has a shape of a straight line. During operation,
gears transfer torque, which results in a normal force FnY acting in
an arbitrary meshing point Y between the two teeth in contact. The normal force
FnY can be decomposed to radial FrY and tangential force
FtY. In involute gear pairs, the normal force acts along the path of
contact. The gears start to mesh in point A, this is point A1 on the
flank of drive gear and point A2 on the flank of the driven gear. In
the meshing area A-B, two pairs of teeth are in contact therefore the
transmitted load is divided between them. Point B is the highest point of
single tooth contact for the driven gear. In the area B-D, the total load is
transmitted only through one pair of teeth. Point D is the lowest point of
single tooth contact for the driven gear, in this point the next pair of teeth
comes into contact and the load is in the area D-E again transmitted via two
pairs of teeth. Hence, the load on a single tooth is not constant during
meshing along the path of contact. Meshing ends in point E, this is point E1
on the flank of the drive gear and point E2 on the flank of the
driven gear. When gears are meshing from A to C, the flank part A1C1
on the drive gear is meshing with the flank part A2C2 on
the driven gear. Due to the different lengths of the flank parts in contact,
specific sliding occurs between the surfaces in contact. Analogously, the same
happens in the meshing part from C to E, except that when passing through the
kinematic point C, the direction of sliding is reversed. Most sliding occurs in
the root part of the tooth, where the greatest wear is to be expected. In theory,
there is no sliding at pitch point C, only pure rolling, in reality, due to
tooth deflection, sliding also occurs in point C. Such specific contact
conditions can be best represented by a gear-on-gear test.
Different wear
characterization methods can be used to measure the wear. The most commonly
used ones are the gravimetric method, and the tooth thickness reduction method.
When employing the gravimetric method wear is characterized as the loss of
mass, while in the tooth thickness reduction method the wear is determined as
the reduced tooth's chordal thickness. Several advanced methods can also be
used, e.g. image processing or optical measurements, however these are more
cost and labor expensive. The wear can be tracked during testing by conducting
regular checkpoints or the wear is measured after a specified number of load
cycles.
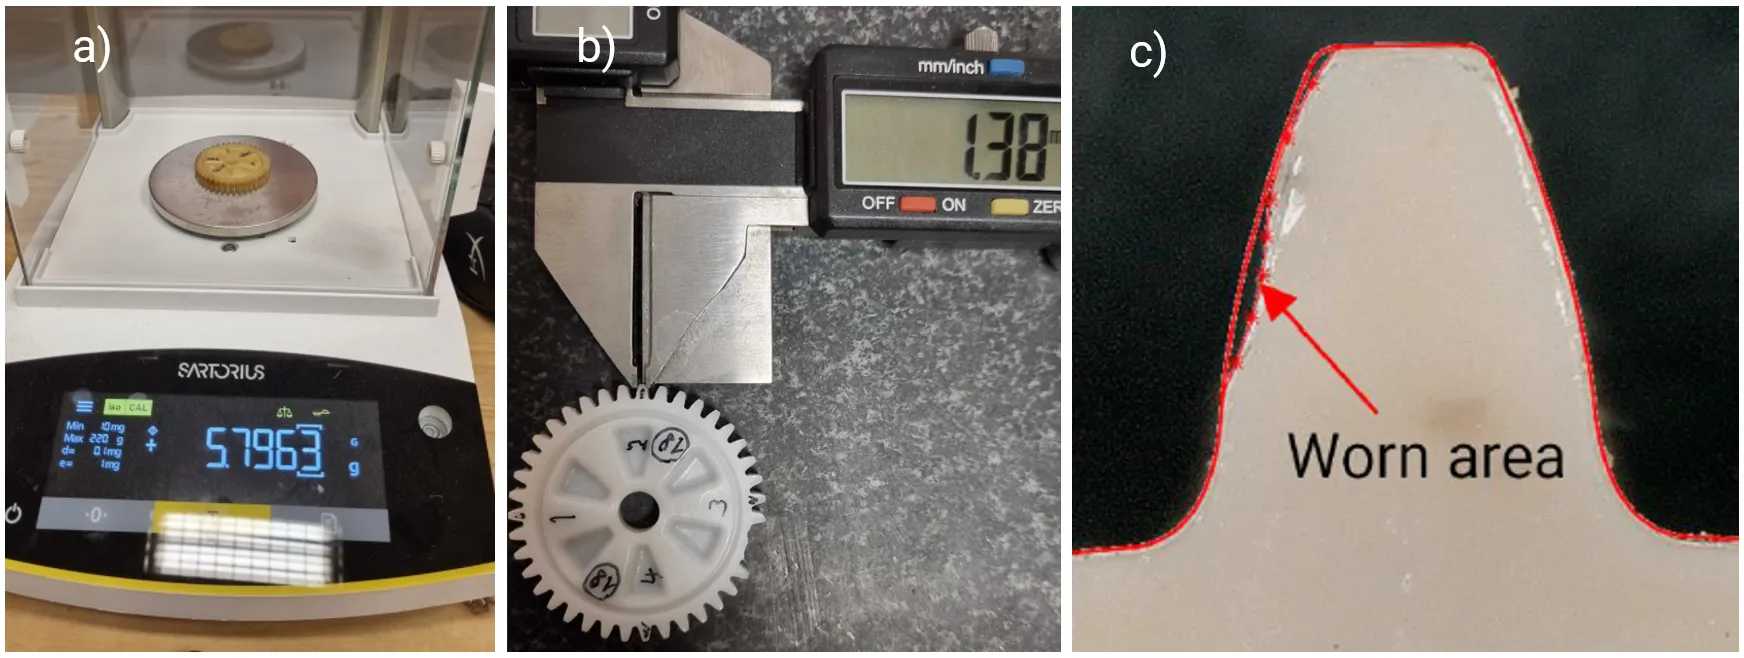
Fig. 3: Wear measuring techniques: a) gravimetric method, b) tooth thickness reduction method,
c) image processing method
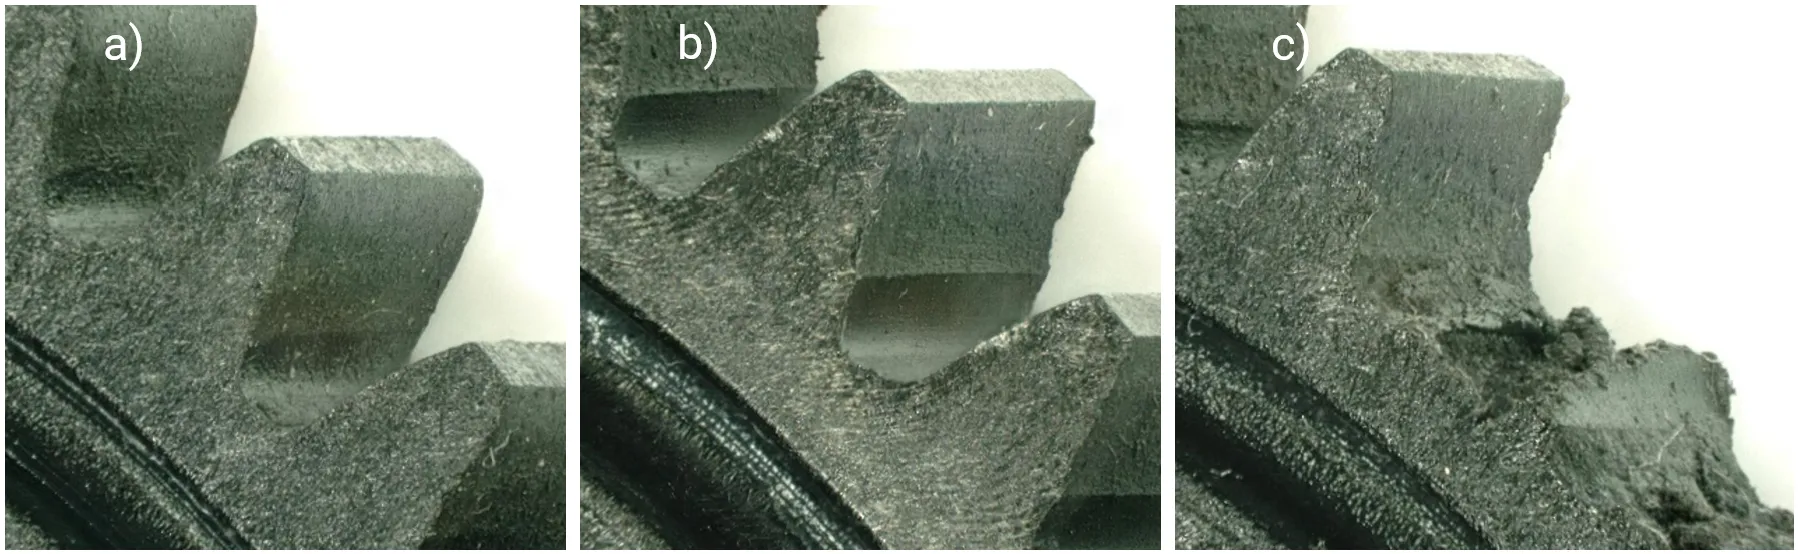
Fig. 4: Wear in different stages: a) initial wear, b) significant wear, in practice usually
still acceptable, c) citical wear which led to failure
Evaluation the Coefficient of Friction
There are currently no
methods which would enable to measure the coefficient of friction (COF)
directly during gear operation. However, there are methods which enable
measurement of COF in conditions much closer to a gear contact. The coefficient
of friction can be assed fairly well by the use of the disk-on-disk test
configuration. In such a test configuration two disks made of selected
materials are pressed together with a controlled force and rotate, each with a
respective rotational speed, as to generate a rolling and relatively sliding
contact between them. All possible material combinations can be tested in such
a test configuration, however, when testing plastics, it is crucial that the
plastic sample’s temperature is rigorously controlled as the coefficient of
friction is also temperature dependent. Another possibility to get a very good
assessment on the COF is by employing an implicit characterization method as
proposed by Černe et al.
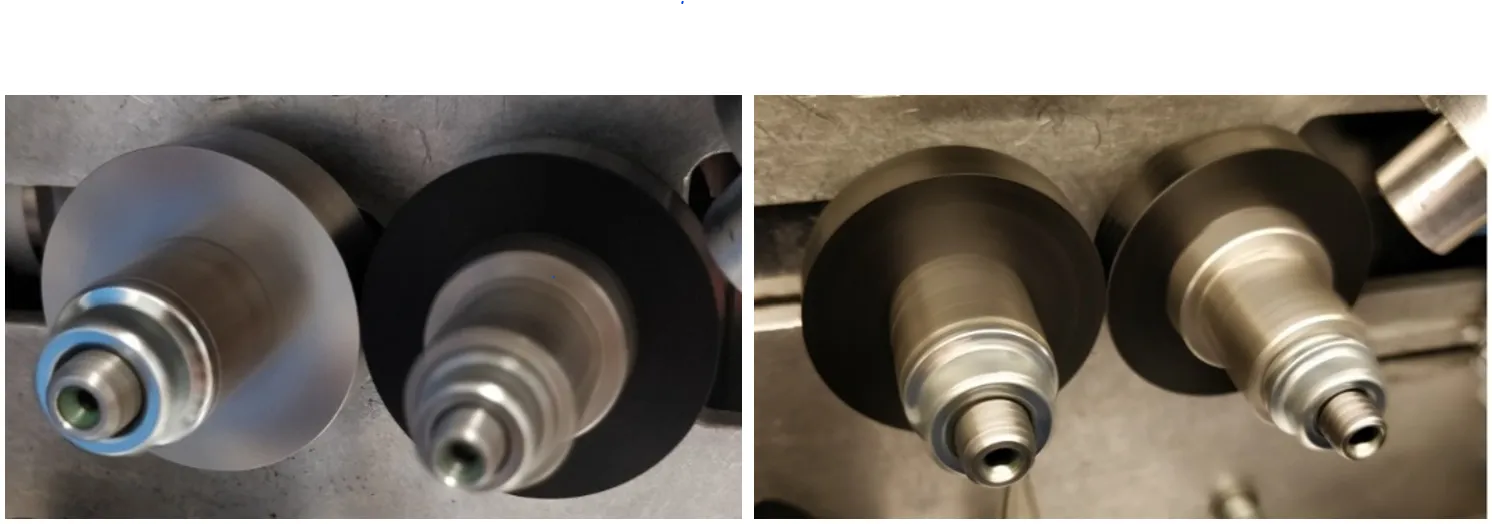
Fig. 5: Disc-on-disc test configuration
References
[1] B. Černe, Z. Bergant, R. Šturm, J. Tavčar, D. Zorko, Experimental and numerical analysis of laminated carbon fibre-reinforced polymer gears with implicit model for coefficient-of-friction evaluation, Journal of Computational Design and Engineering 9 (2022) 246–262. https://doi.org/10.1093/jcde/qwab083.